Project type
B2B
Our team
Product Designer
Platform
Desktop Web
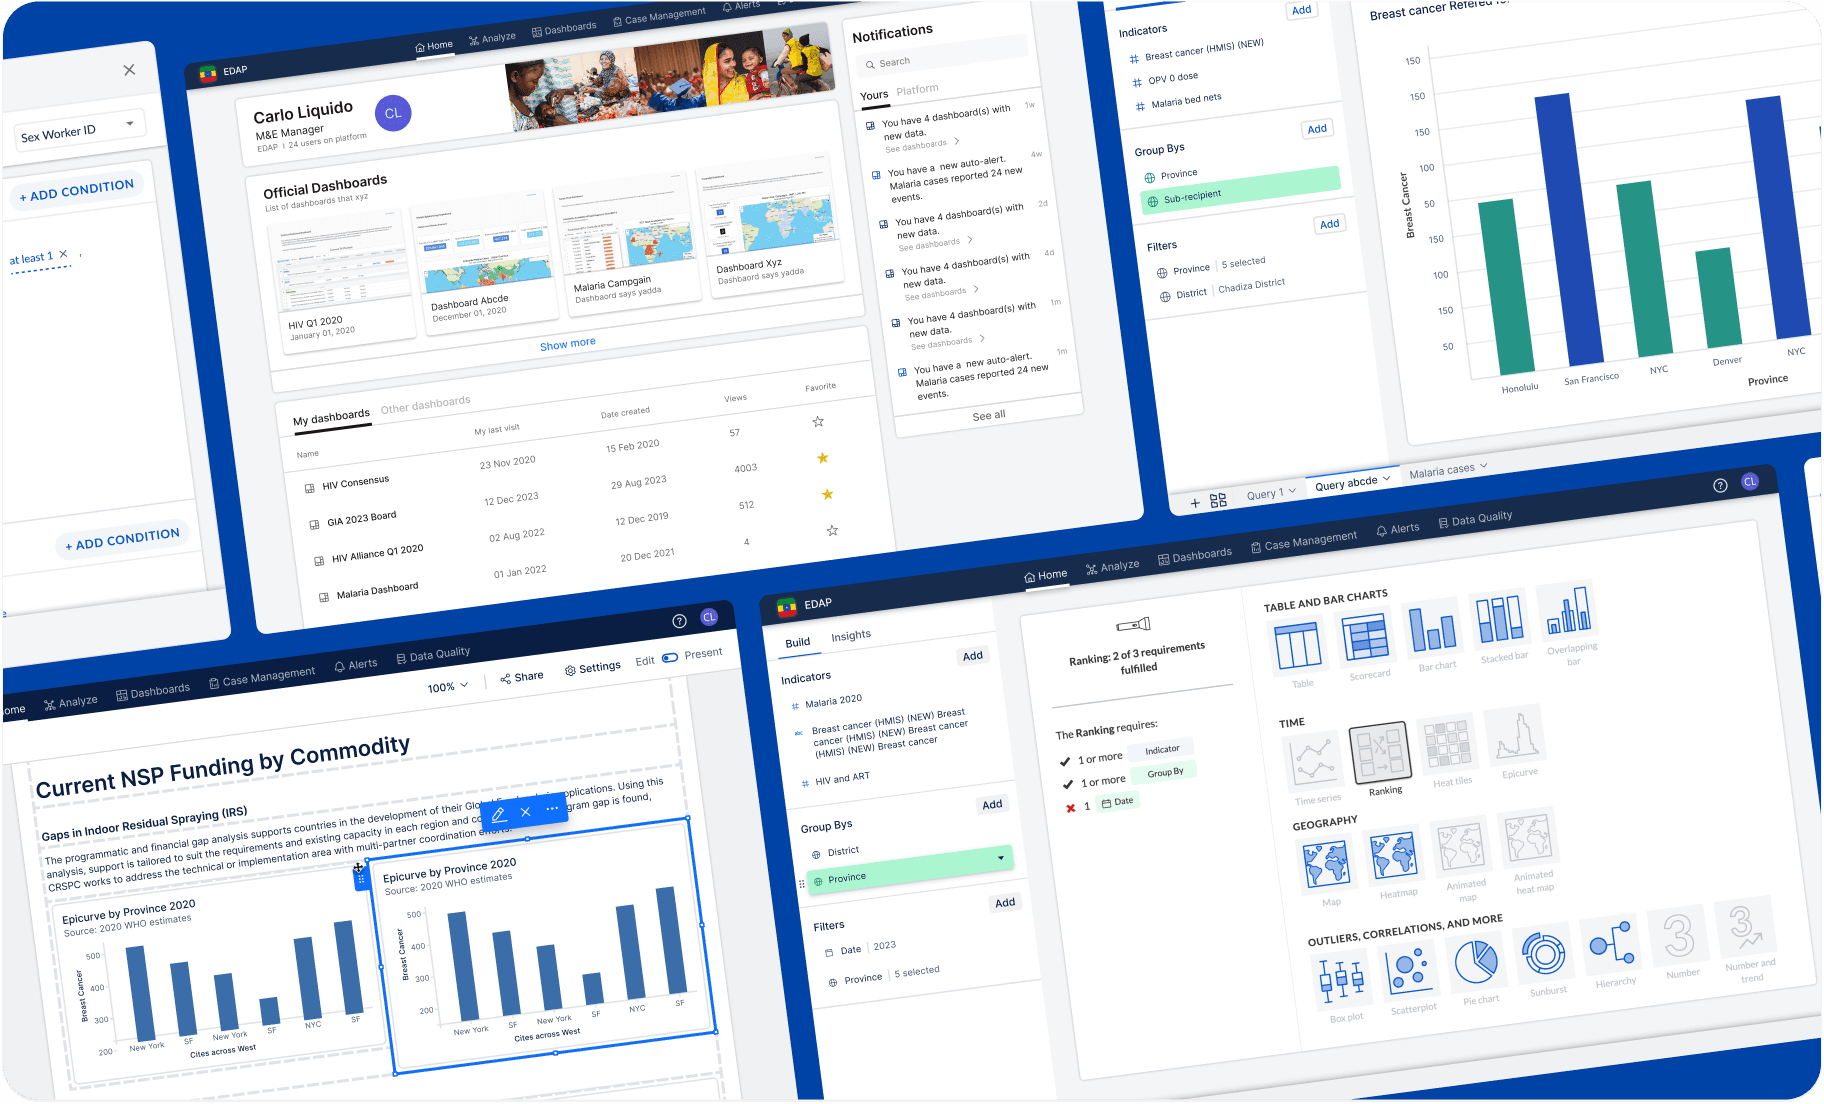
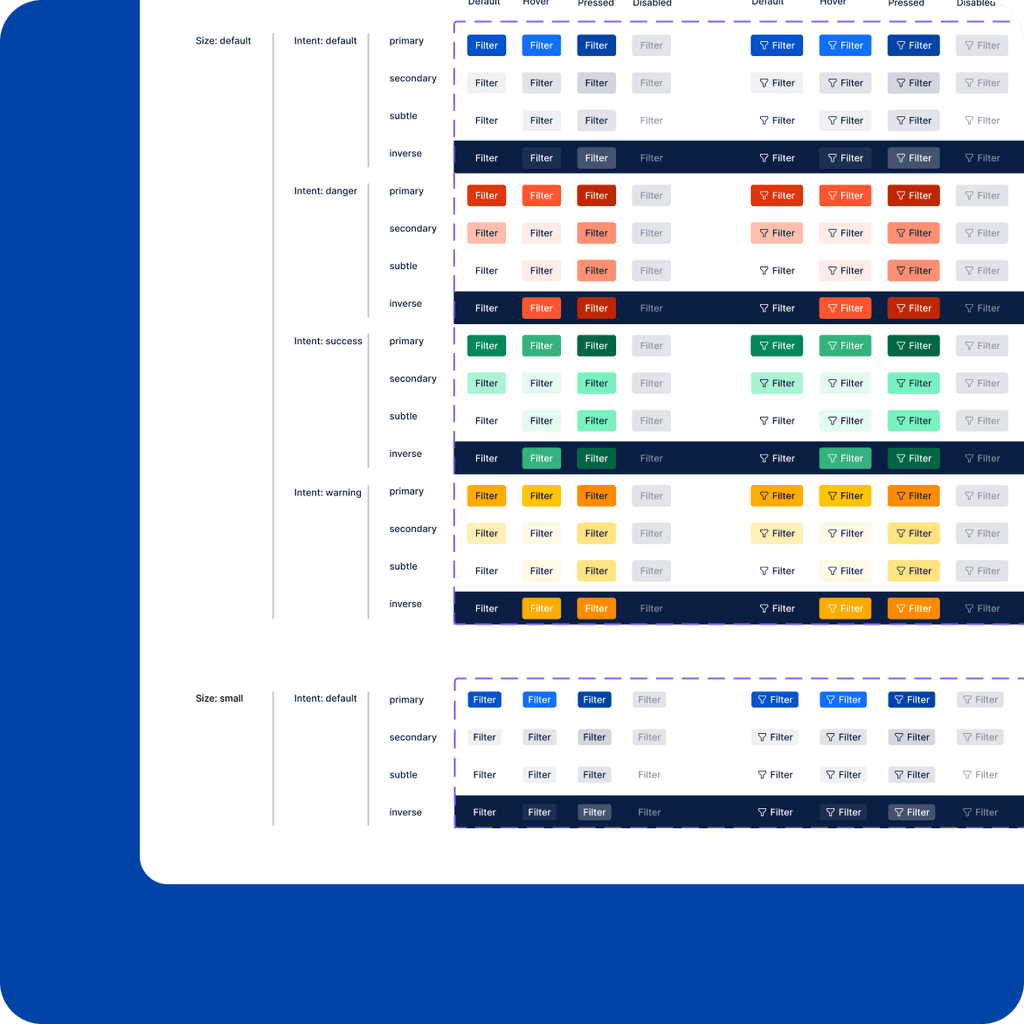
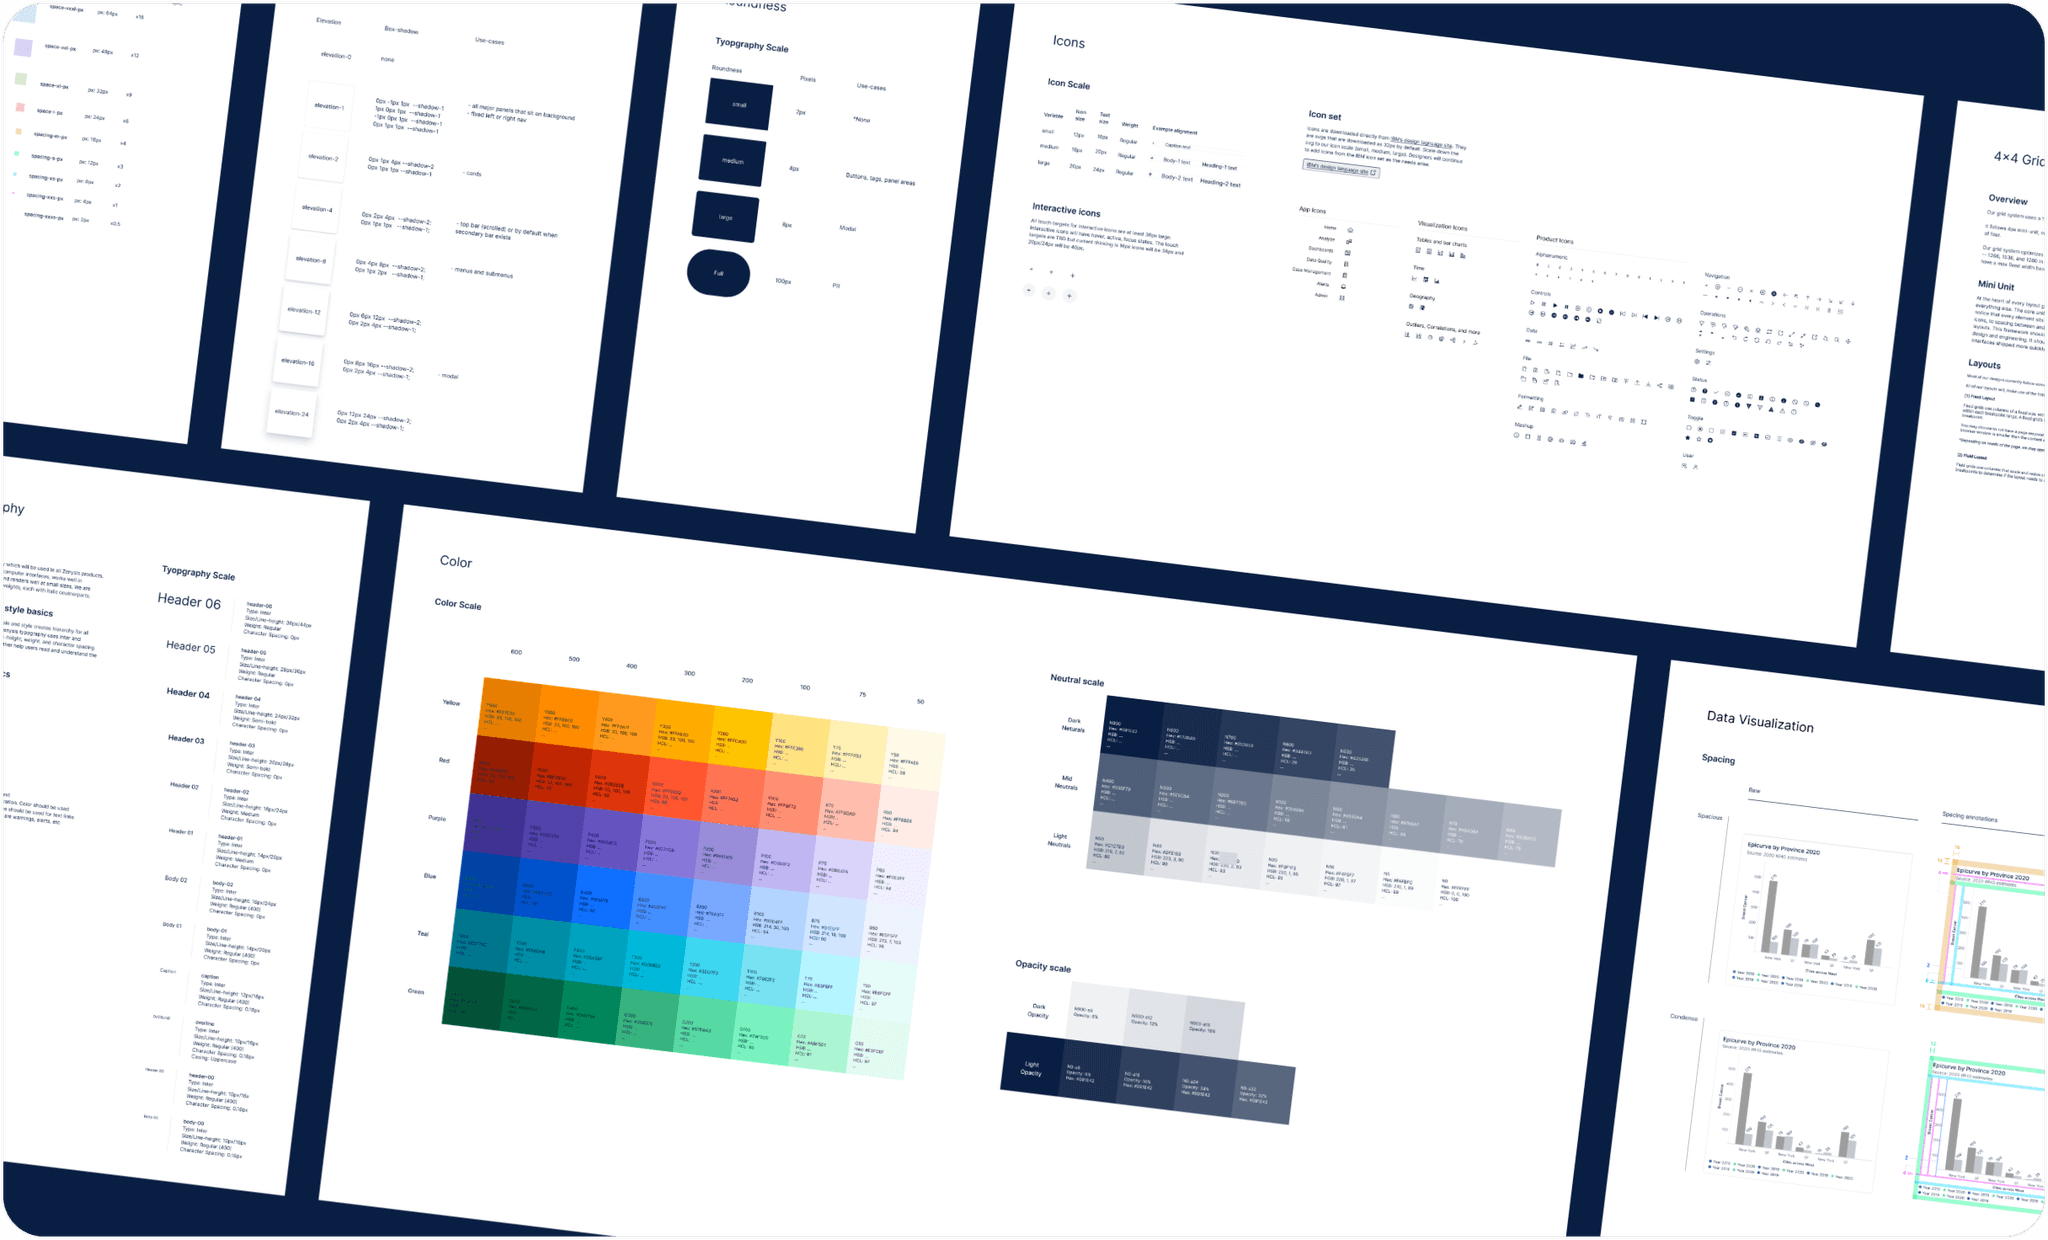
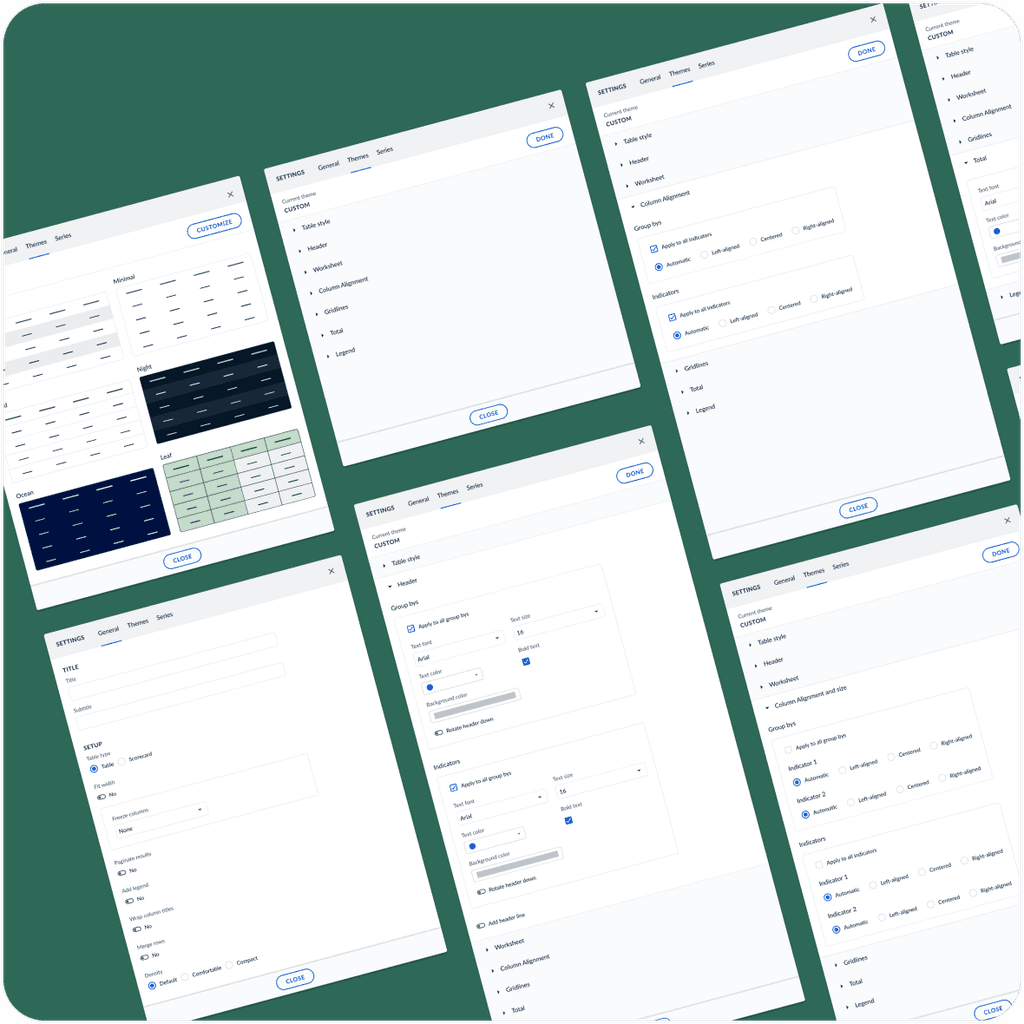
We collaborated with Zenysis to design advanced analytics and operational tools used by public health leaders in 15 countries across Africa, Asia, and Latin America, significantly enhancing decision-making and operational efficiency in large-scale health programs worldwide. To support their entire suite of software tools, we developed a modern, scalable design system to ensure consistency and improve engineering efficiency.
We aimed to balance approachability with advanced capability by incorporating minimal yet high-contrast elements and focusing on interactivity. Our iterative efforts in refining this balance resulted in a modernized experience for health professionals globally.
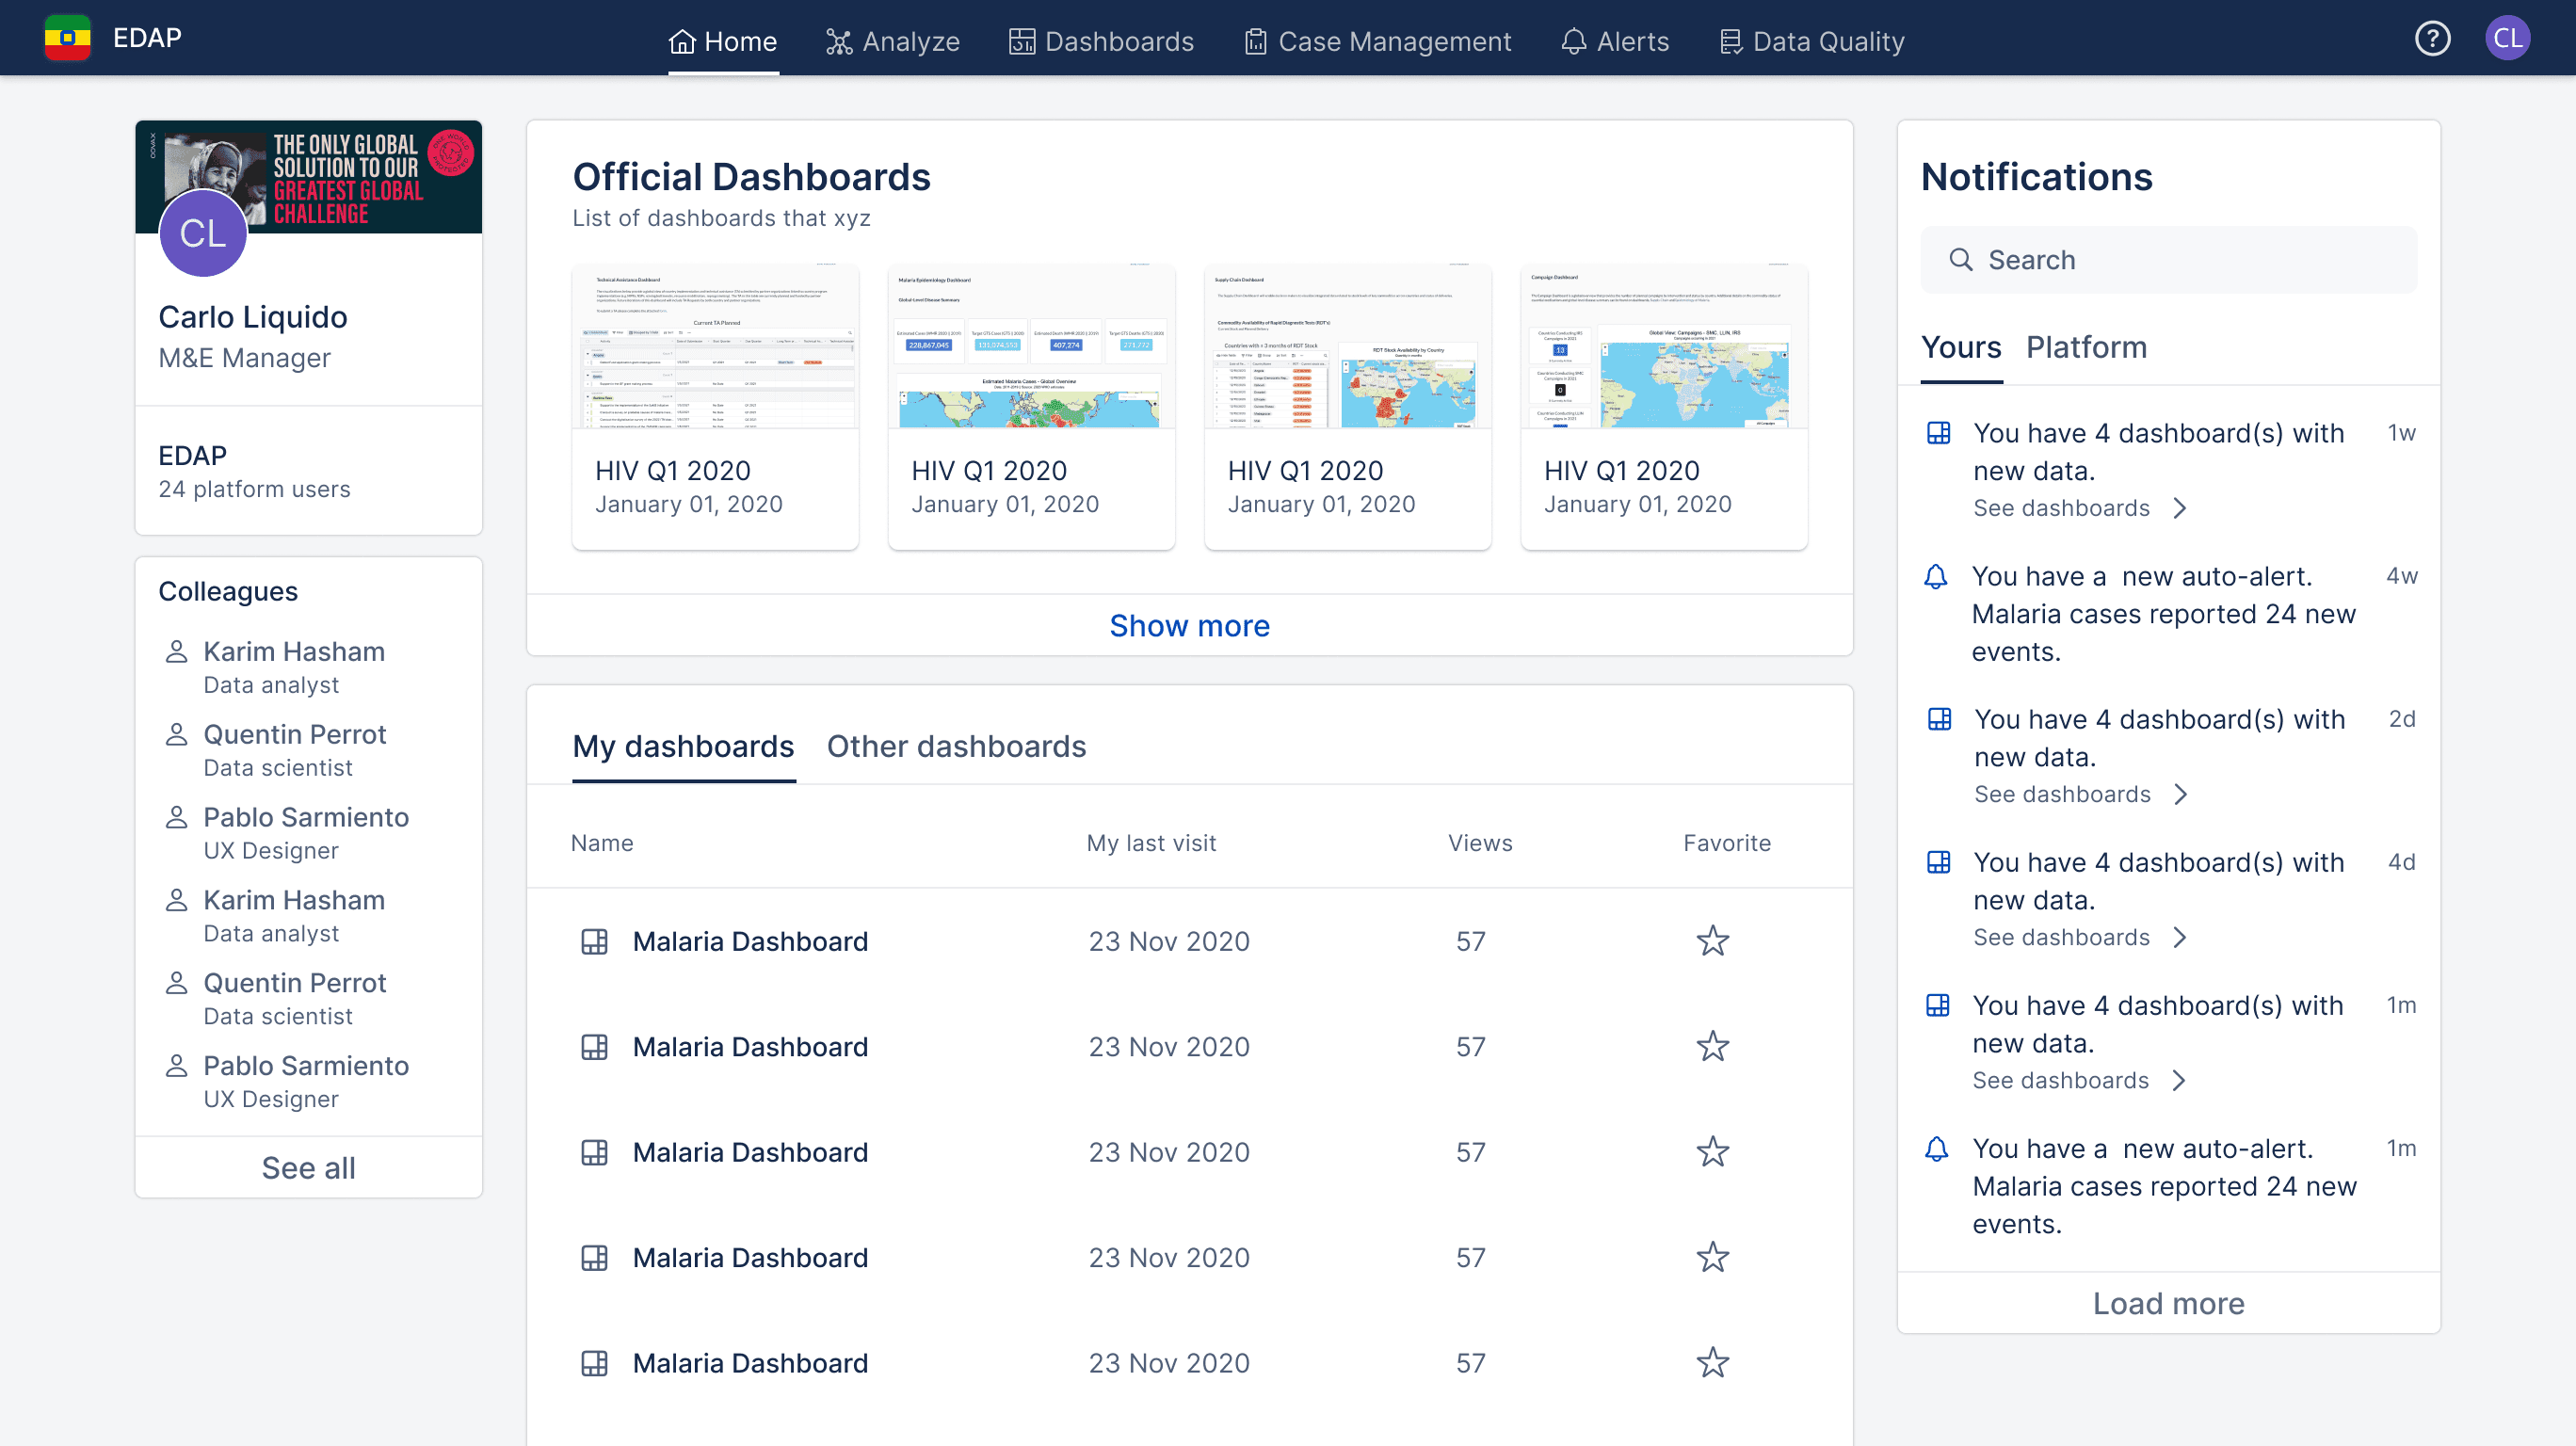
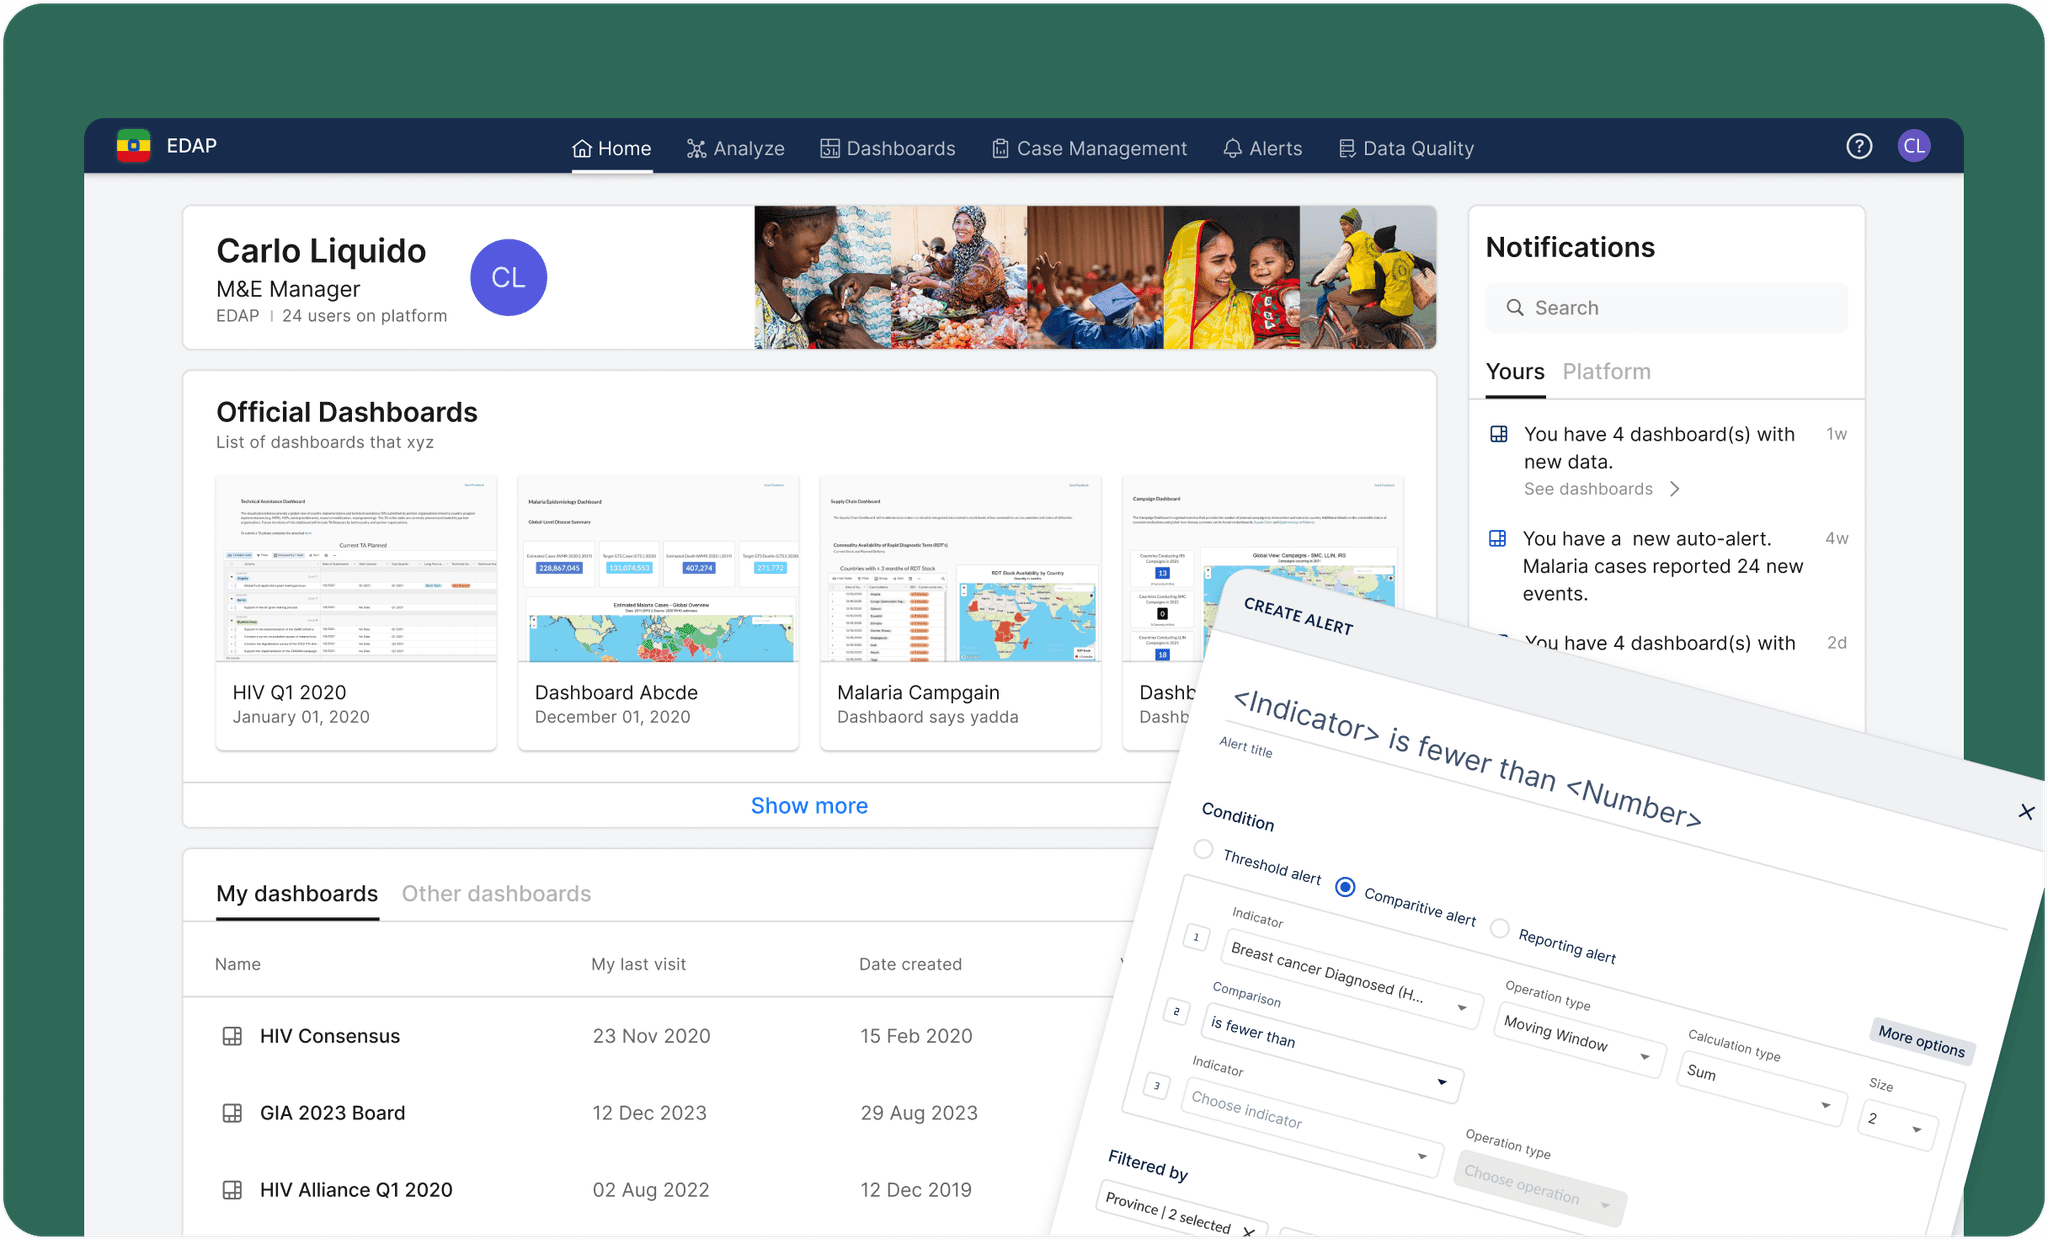
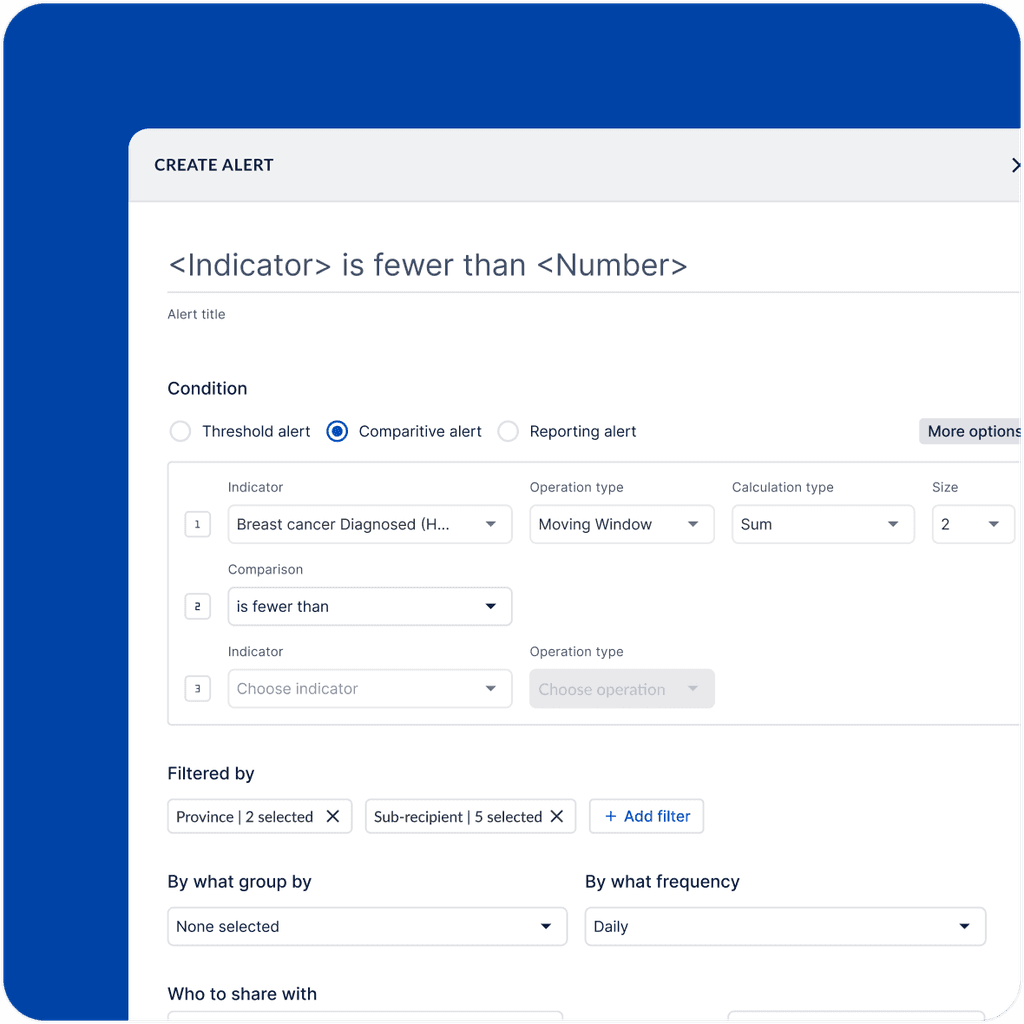
To elevate the homepage experience, we ensured that health professionals could easily access frequently used resources and stay informed about important events. We enabled users to set flexible rules with conditional logic for notifications about critical events and share these alerts with their team.
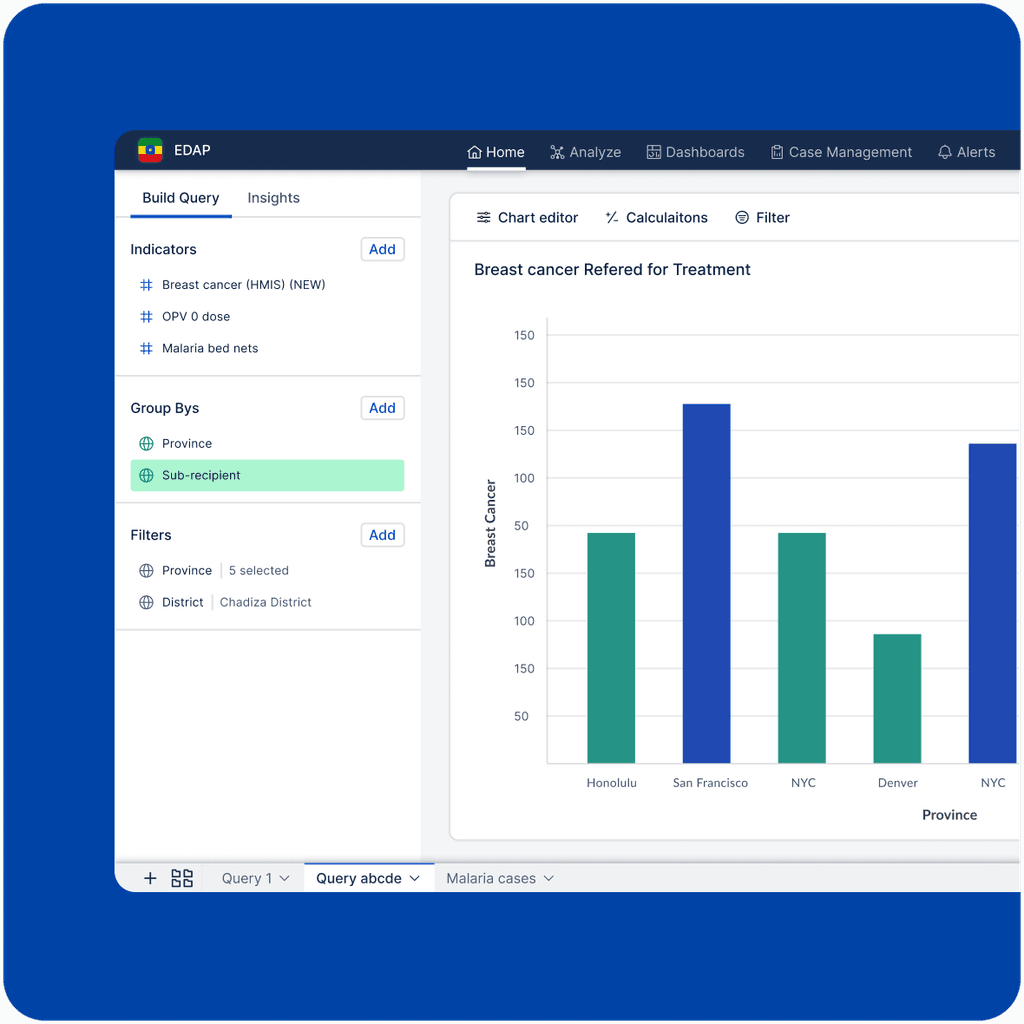
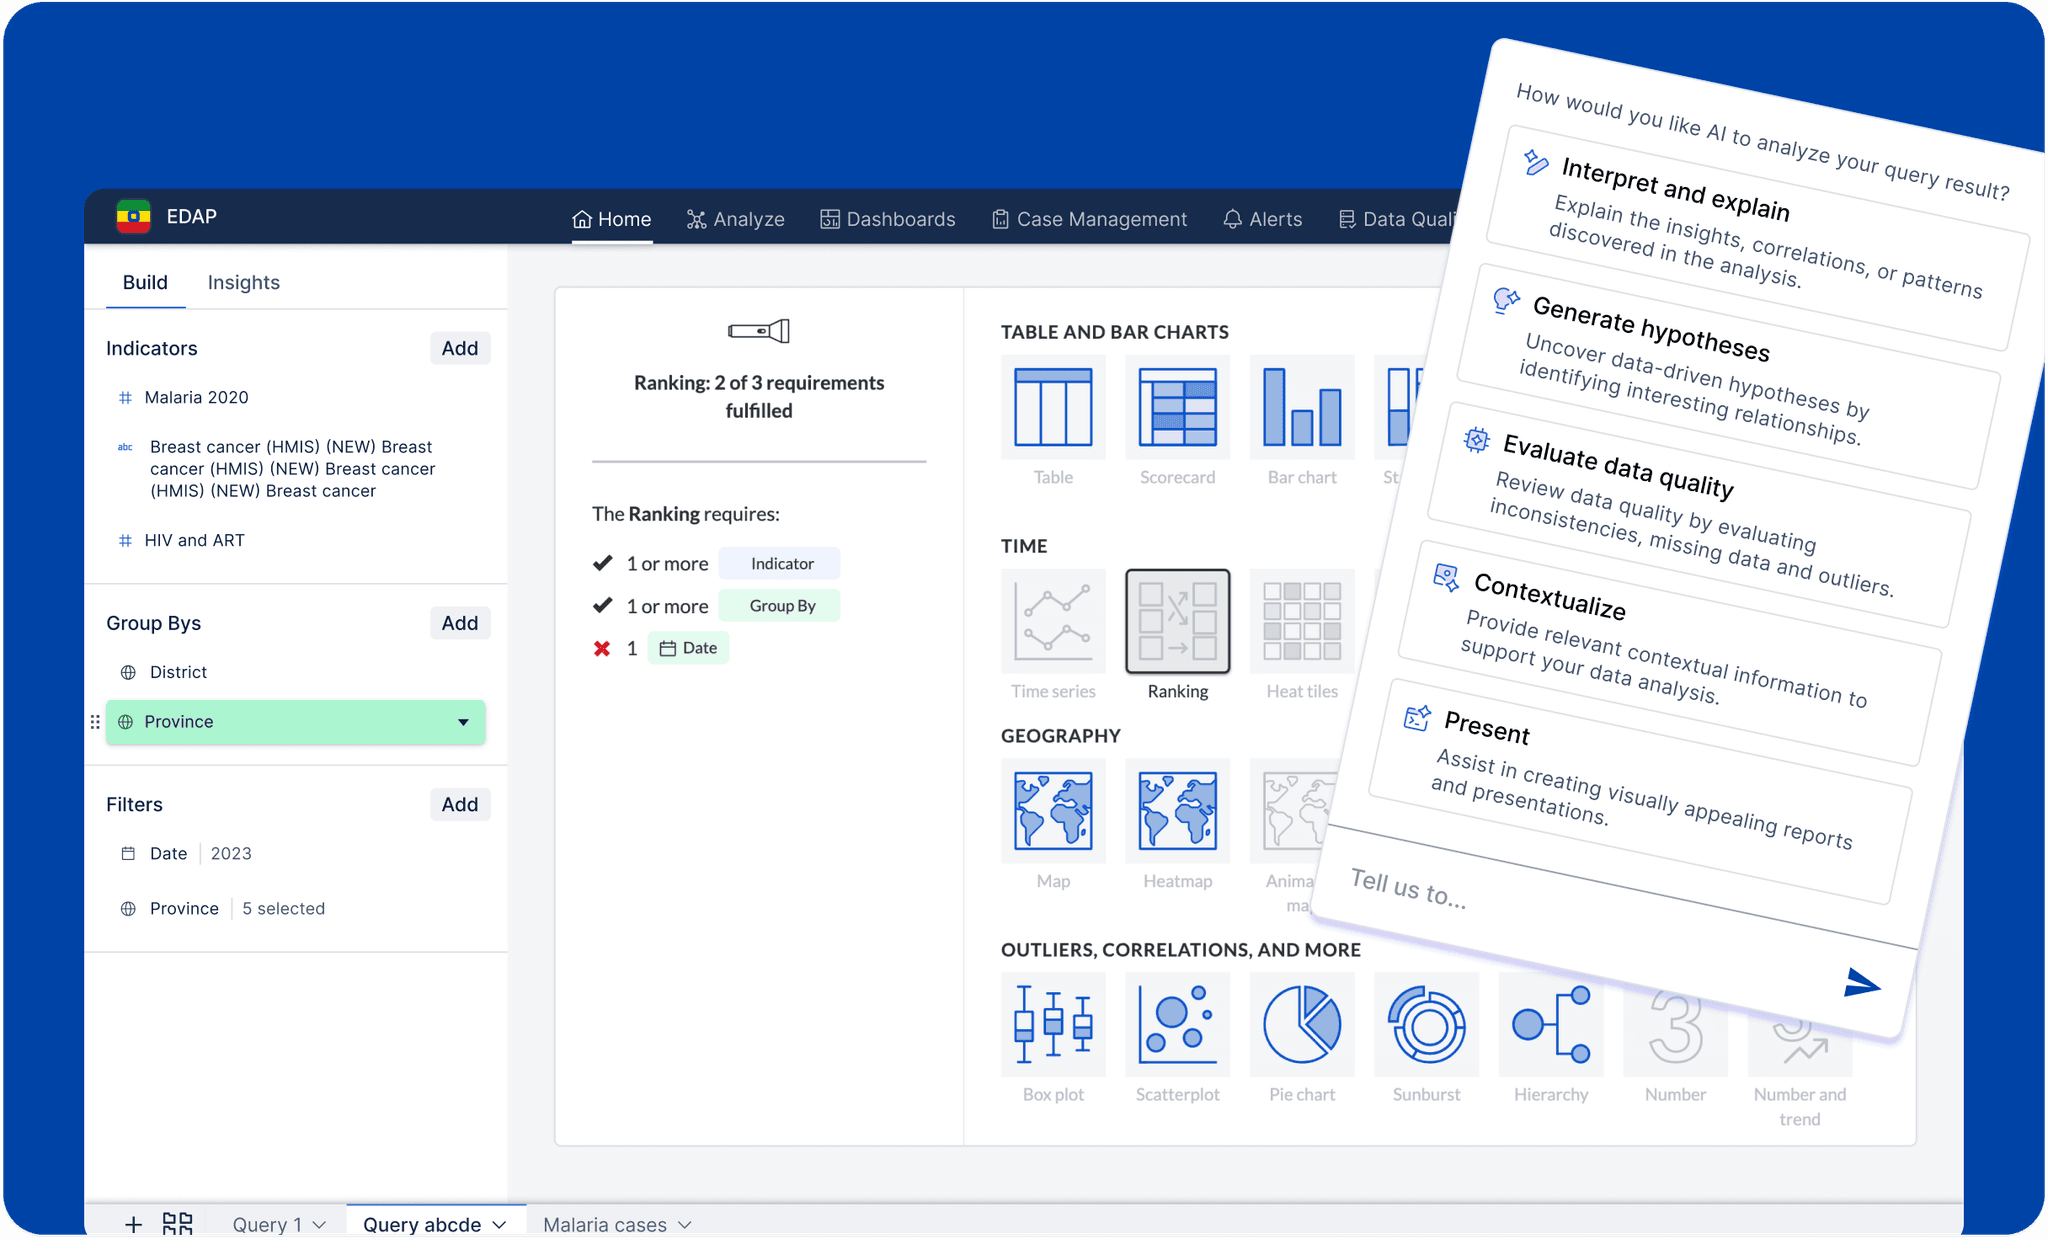
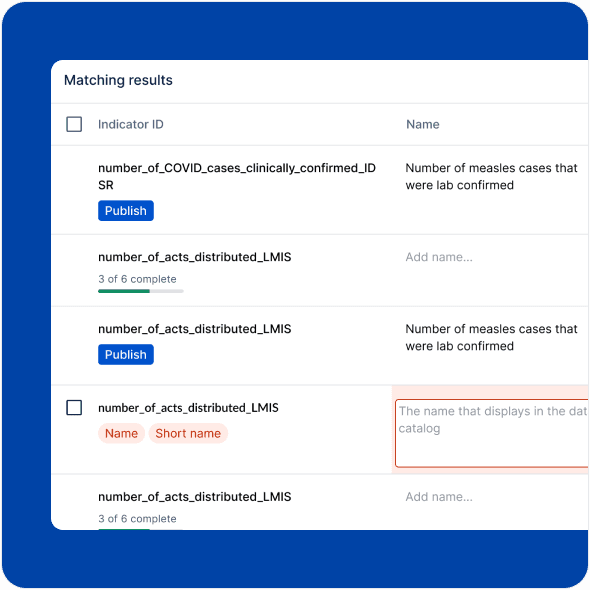
We built analytic tools to simplify complex technical tasks, making them accessible to non-technical users.
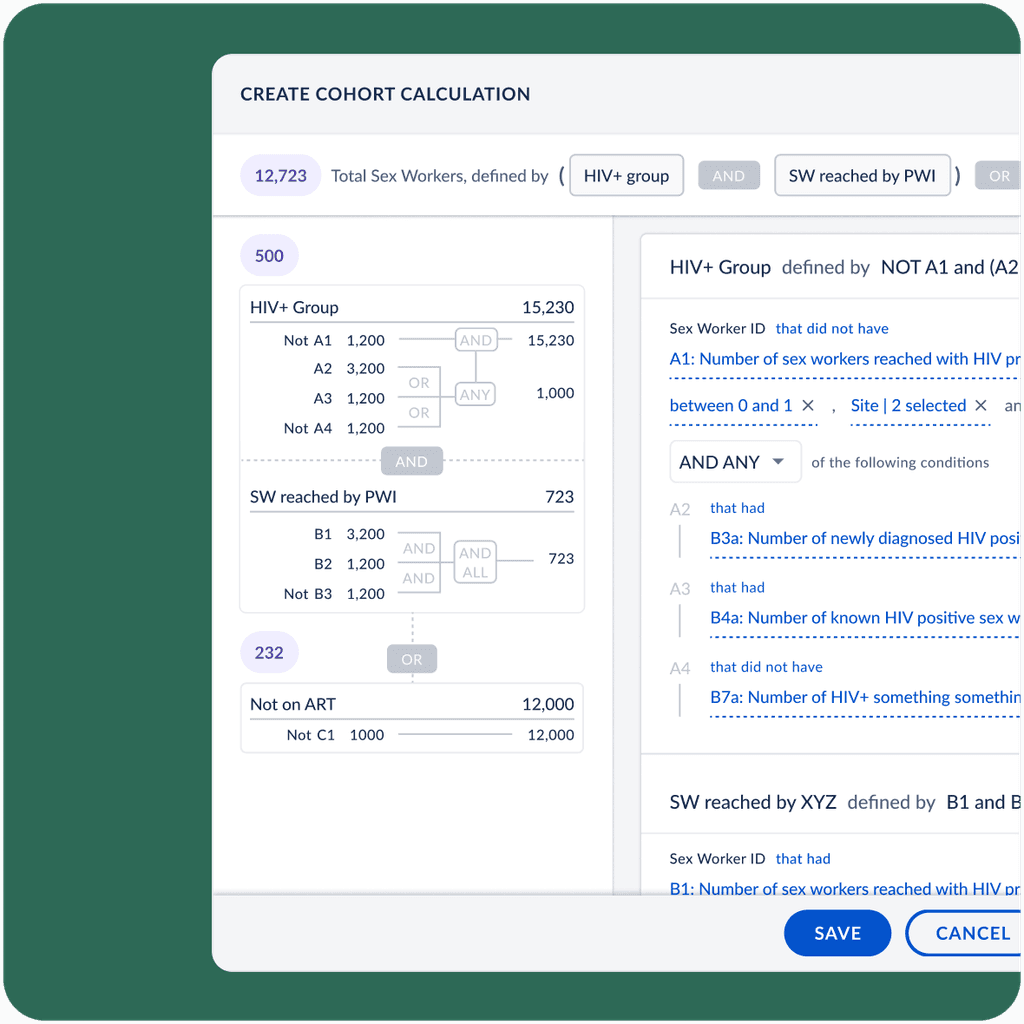
Advanced aggregation tools to open up new avenues for analysis, including cohort analysis that evaluates care cascades across different groups, providing vital insights into disease transmission risks and health outcomes. AI-powered query tools to help users combine data points to reveal patterns. Broad visualizations, guided by built-in rules, to ensure data is represented accurately and effectively.
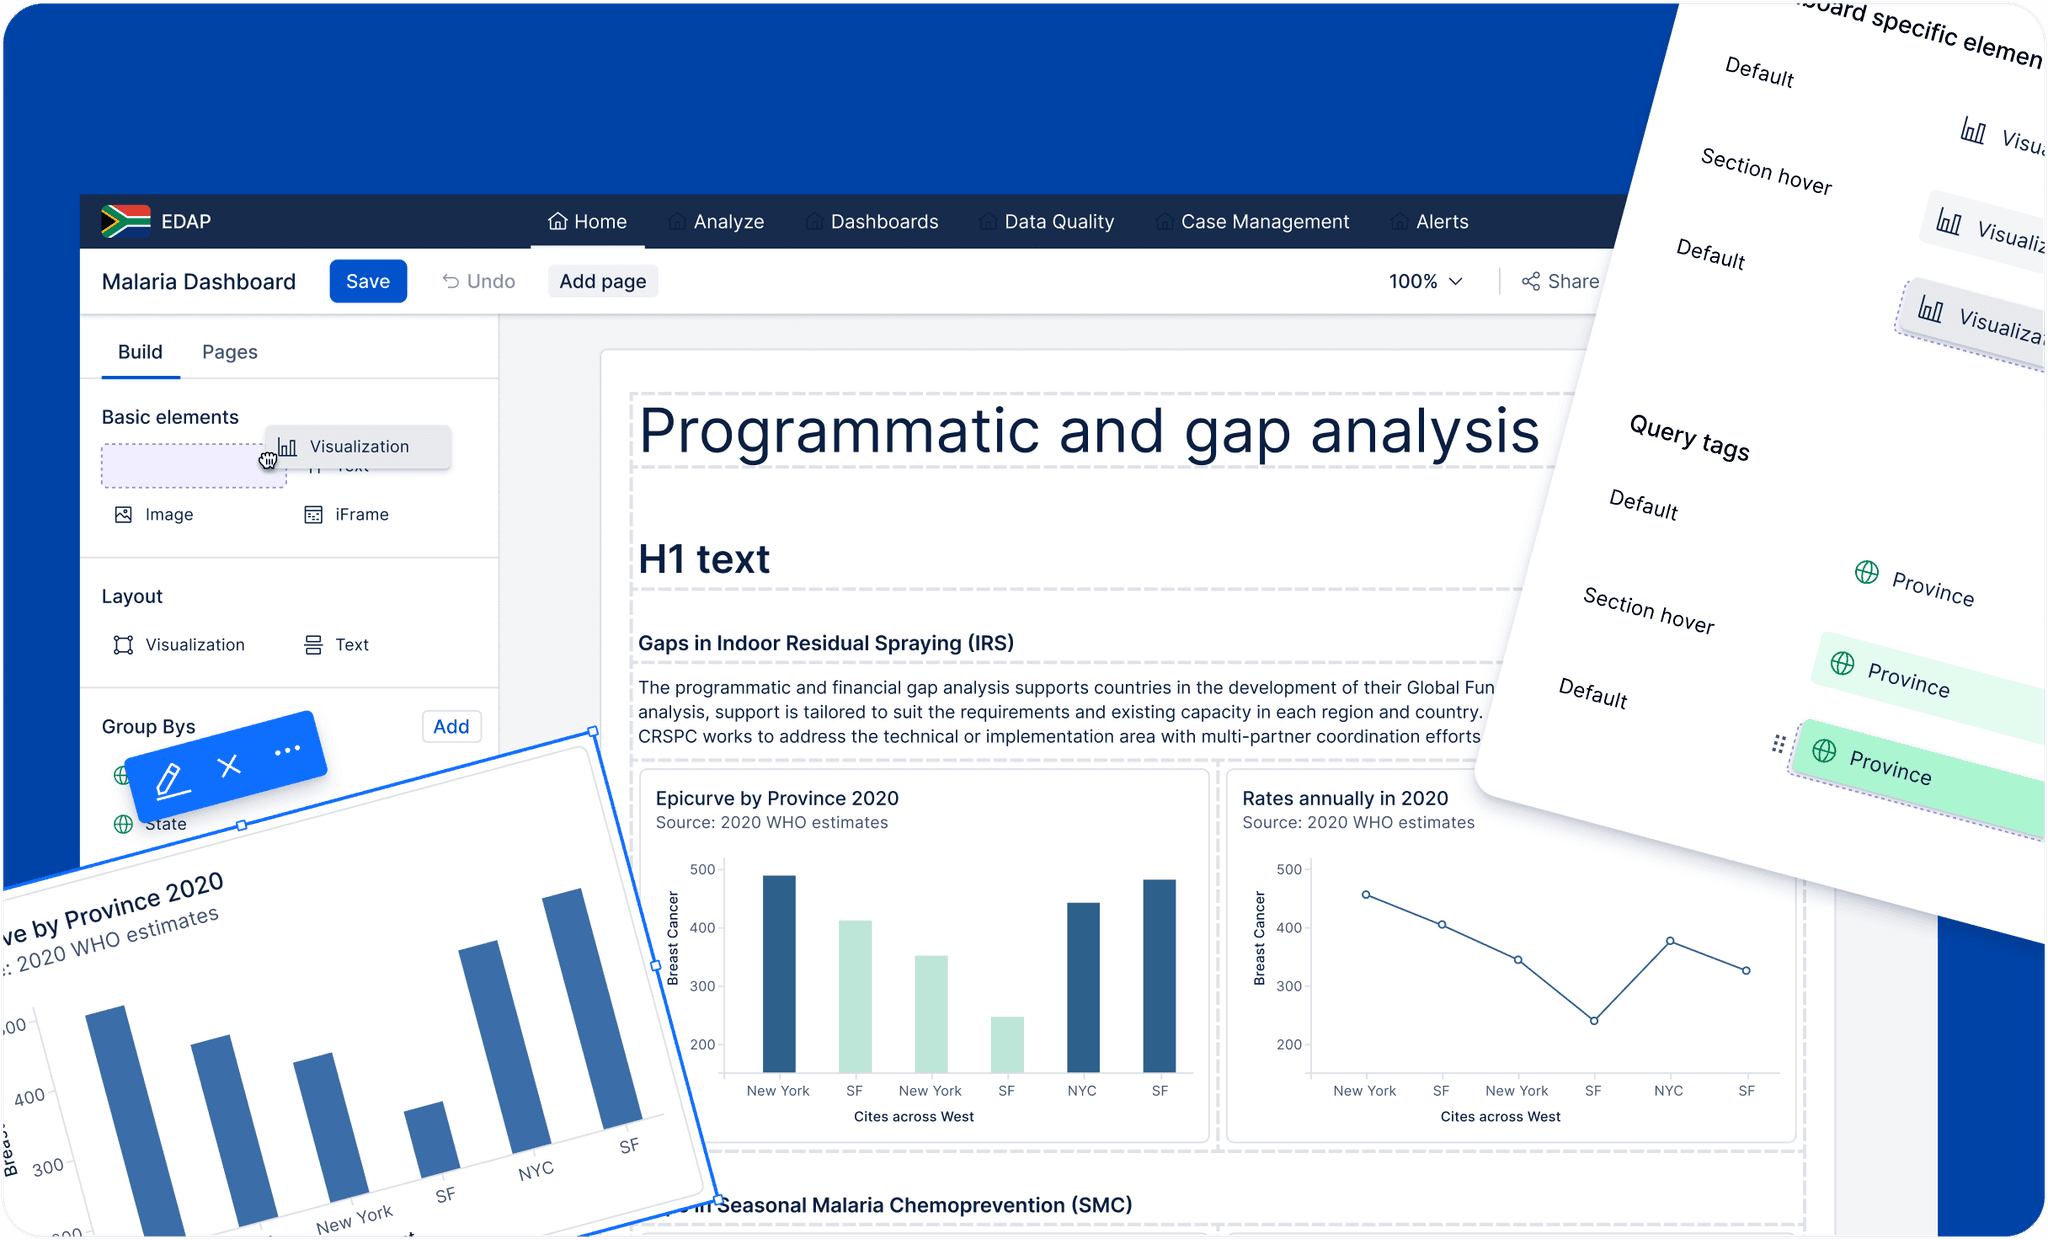
The current dashboard experience was developed years ago, yet user-created dashboards have remained the most popular feature, driving many of the most exciting business opportunities. These opportunities often involve building increasingly complex and powerful dashboards, like the Gates-funded RBM Global Malaria Dashboard.
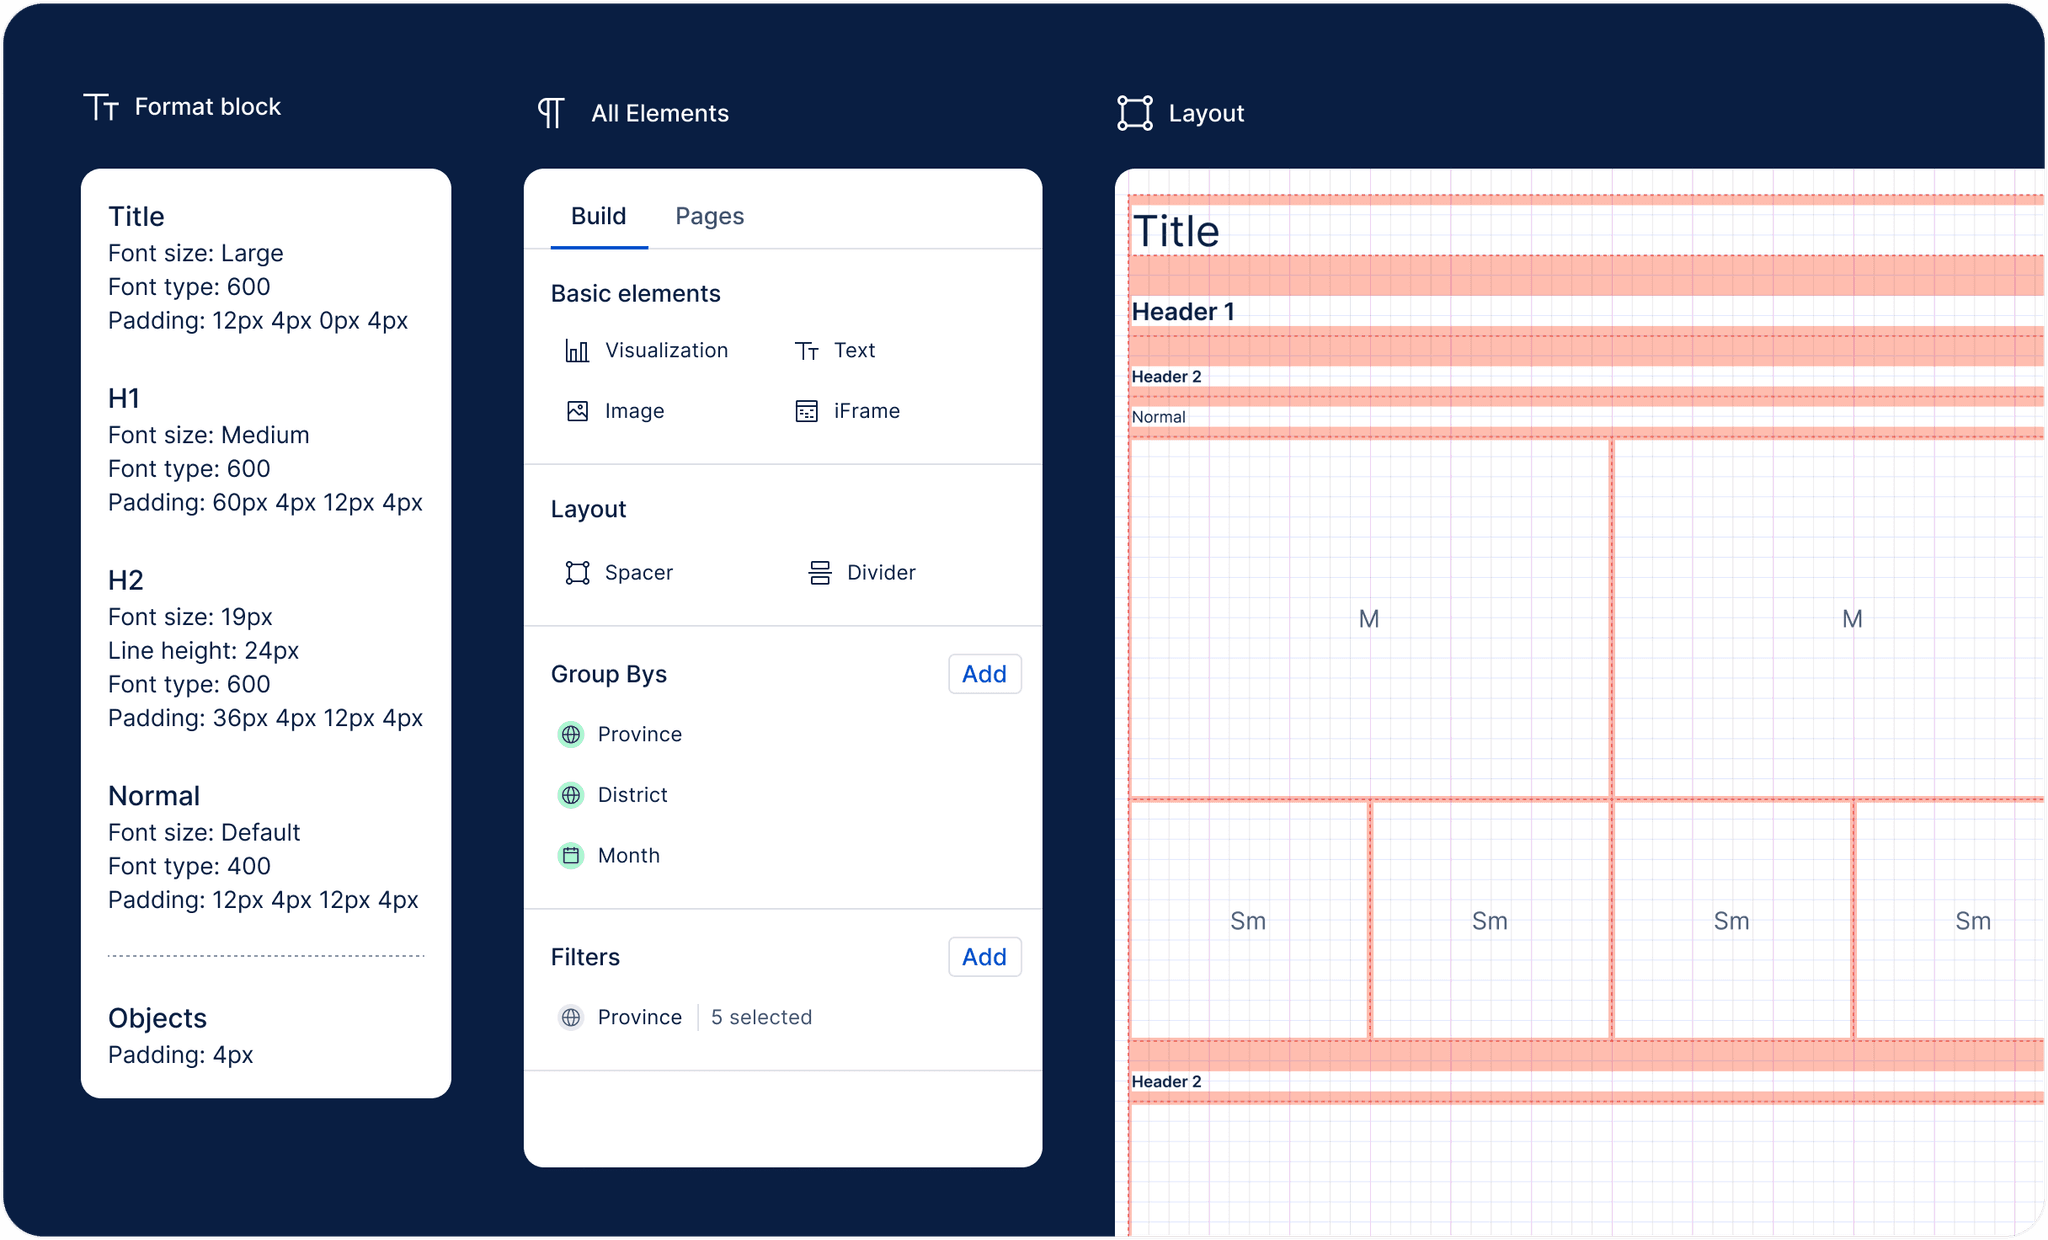
To support this demand, we enhanced the core layout functionality by introducing vertical compacting, a less granular grid system, simplified text hierarchy, and snap points. We then empowered users to create advanced data portals with better navigation, filtering, grouping, and streamlined presentation workflows.

